Data Visualizations & Infographics

My data visualization work blends scientific illustration with clear, engaging storytelling to help make complex marine topics more accessible to the public. These pieces go beyond traditional infographics by combining custom, hand-drawn illustrations with accurate scientific content—designed in close collaboration with NOAA’s National Marine Sanctuaries experts.
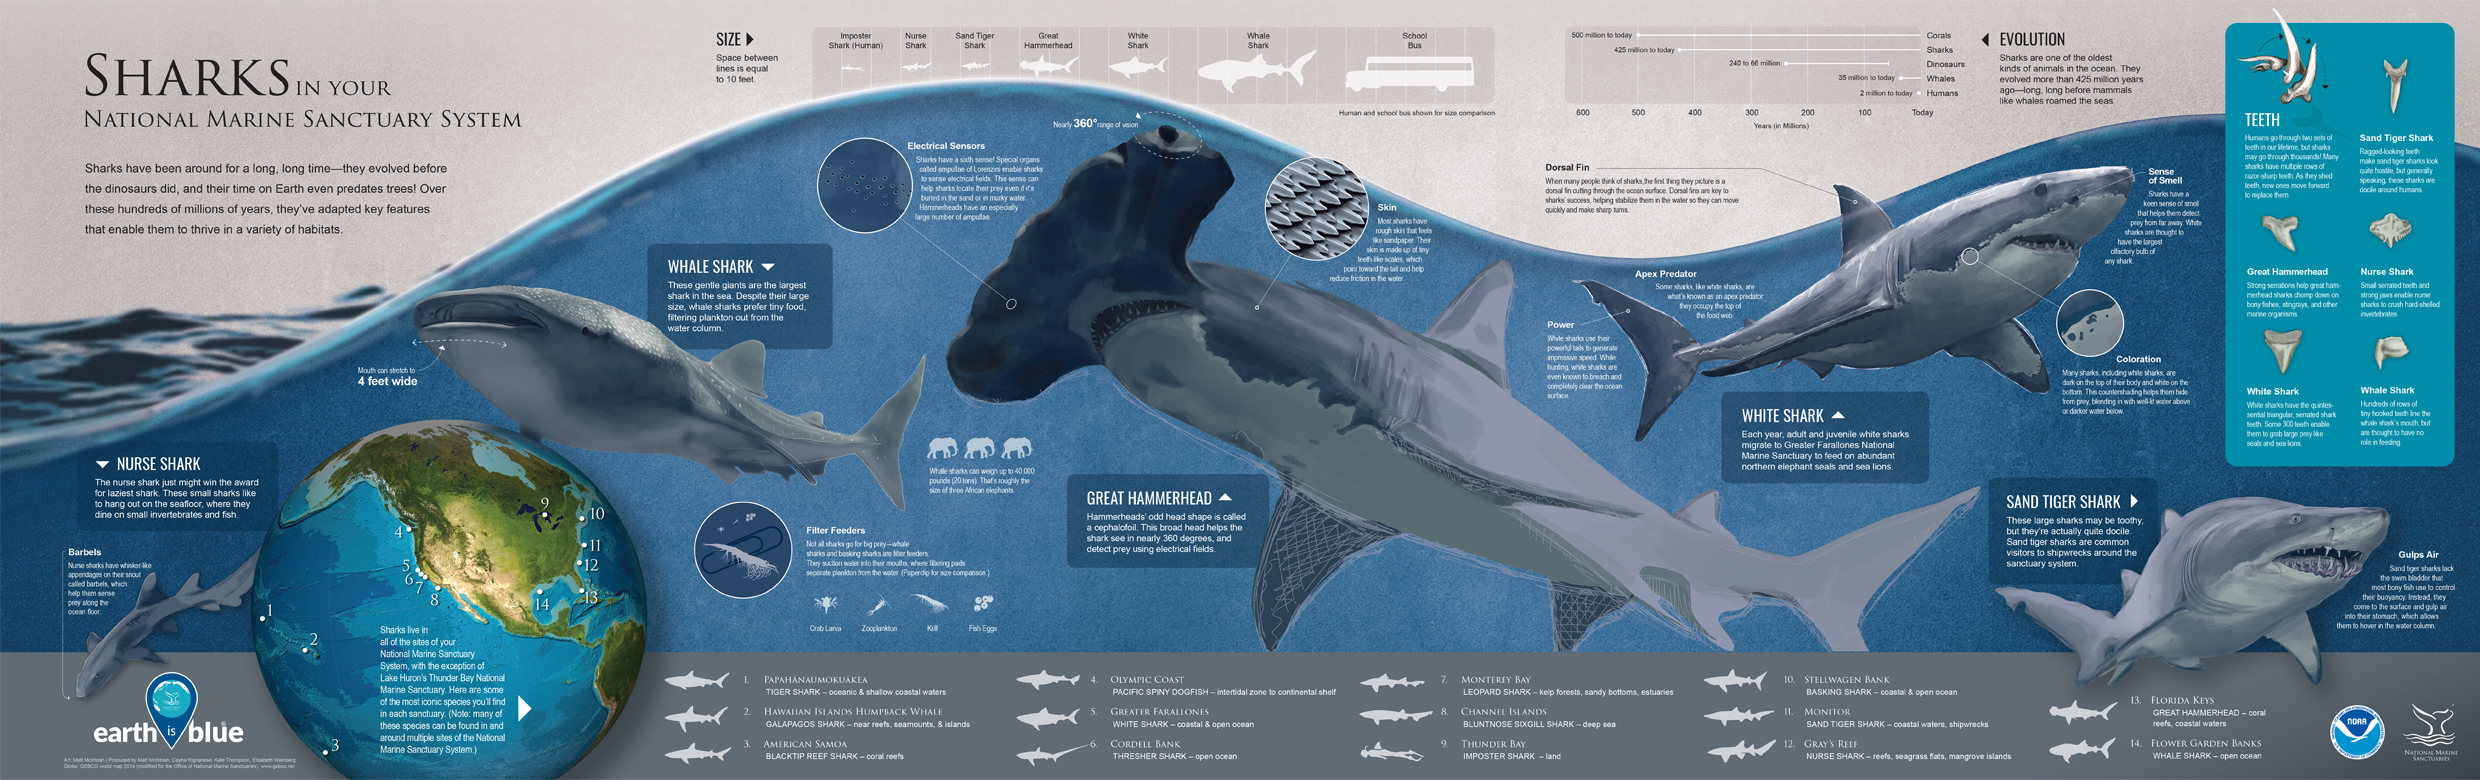
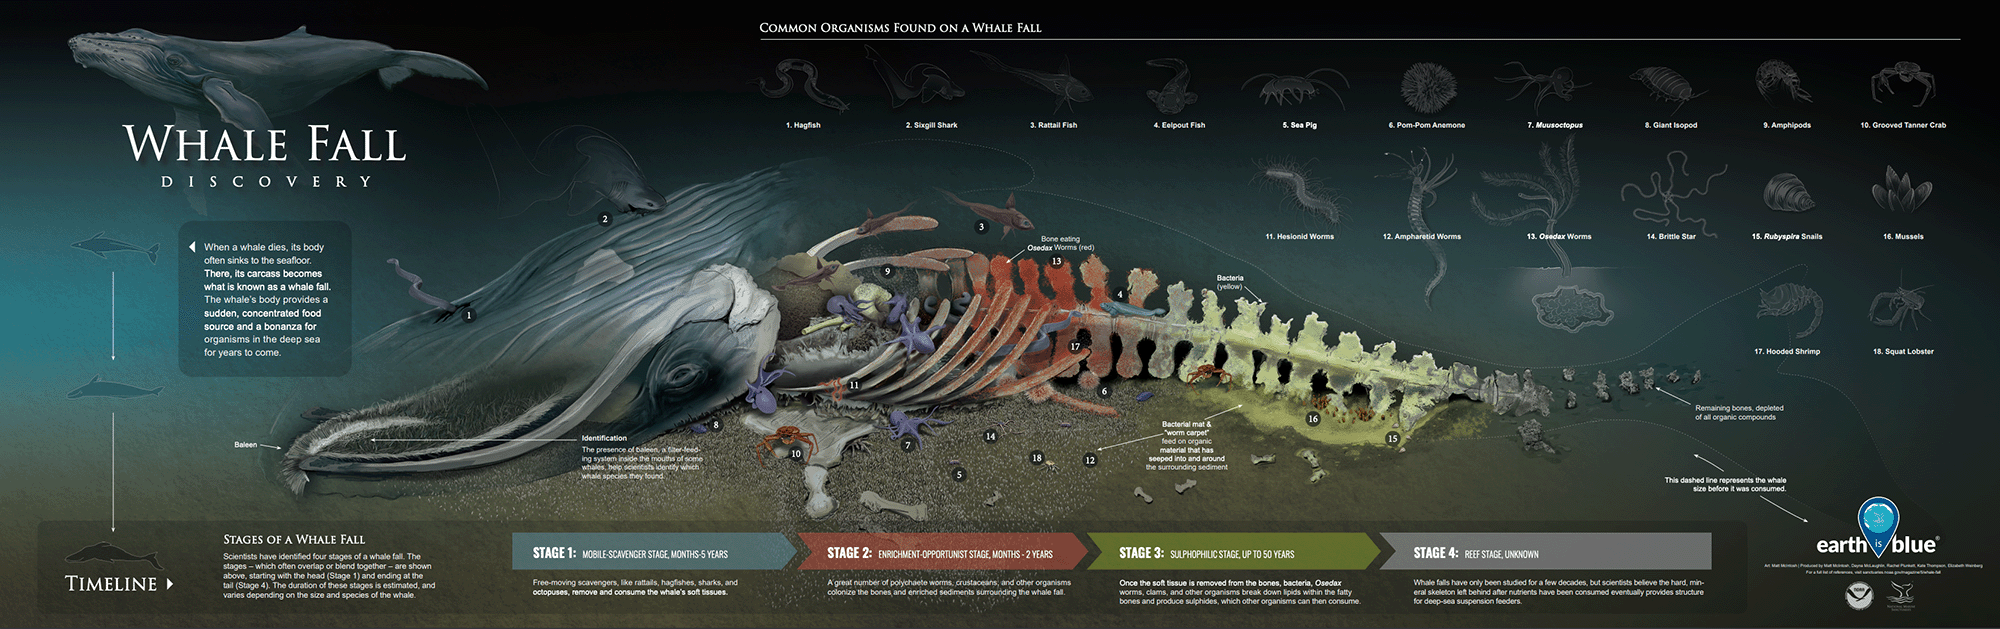
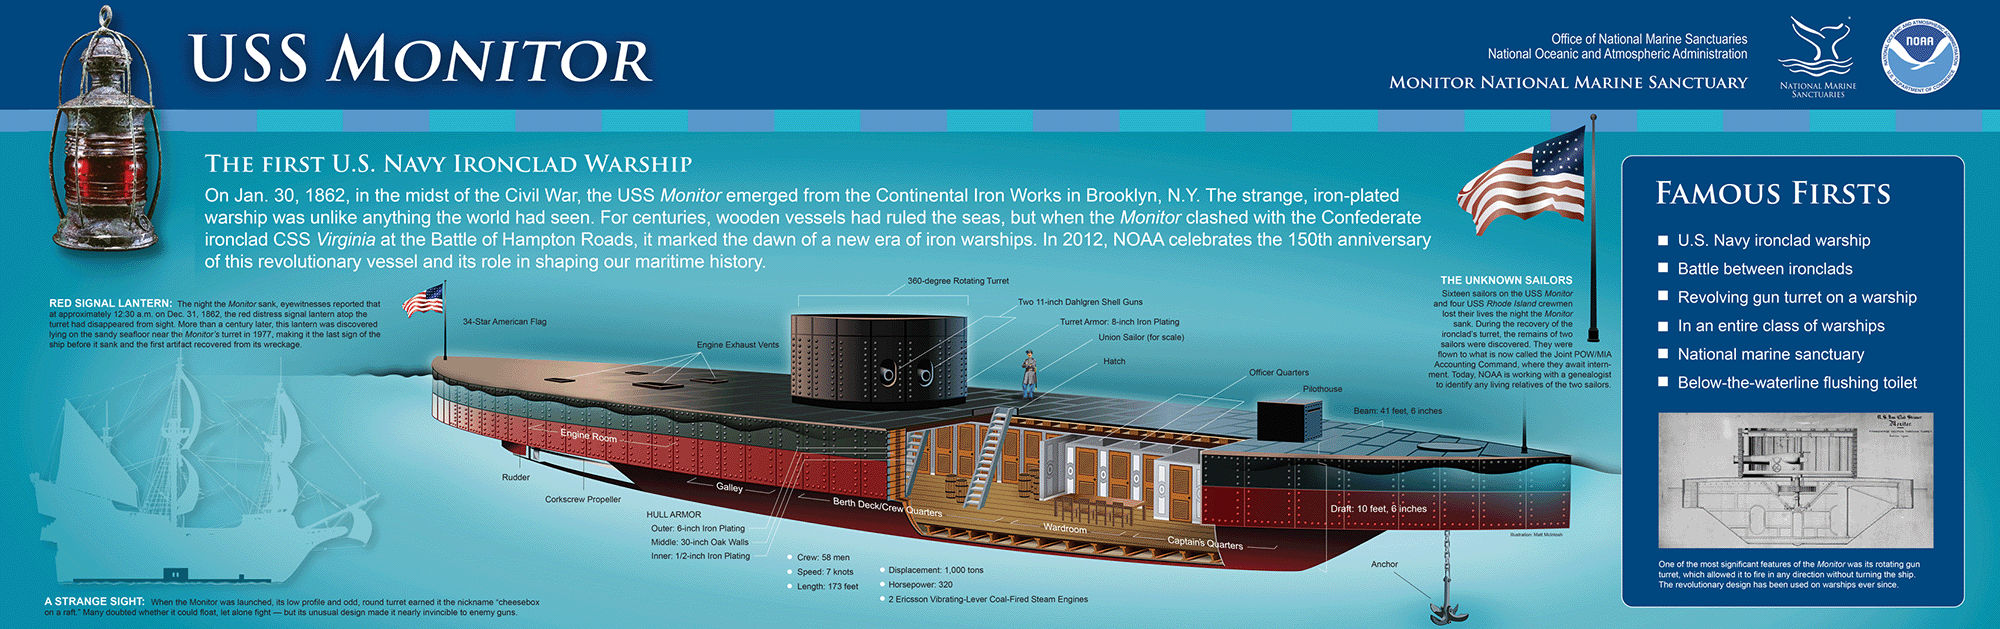
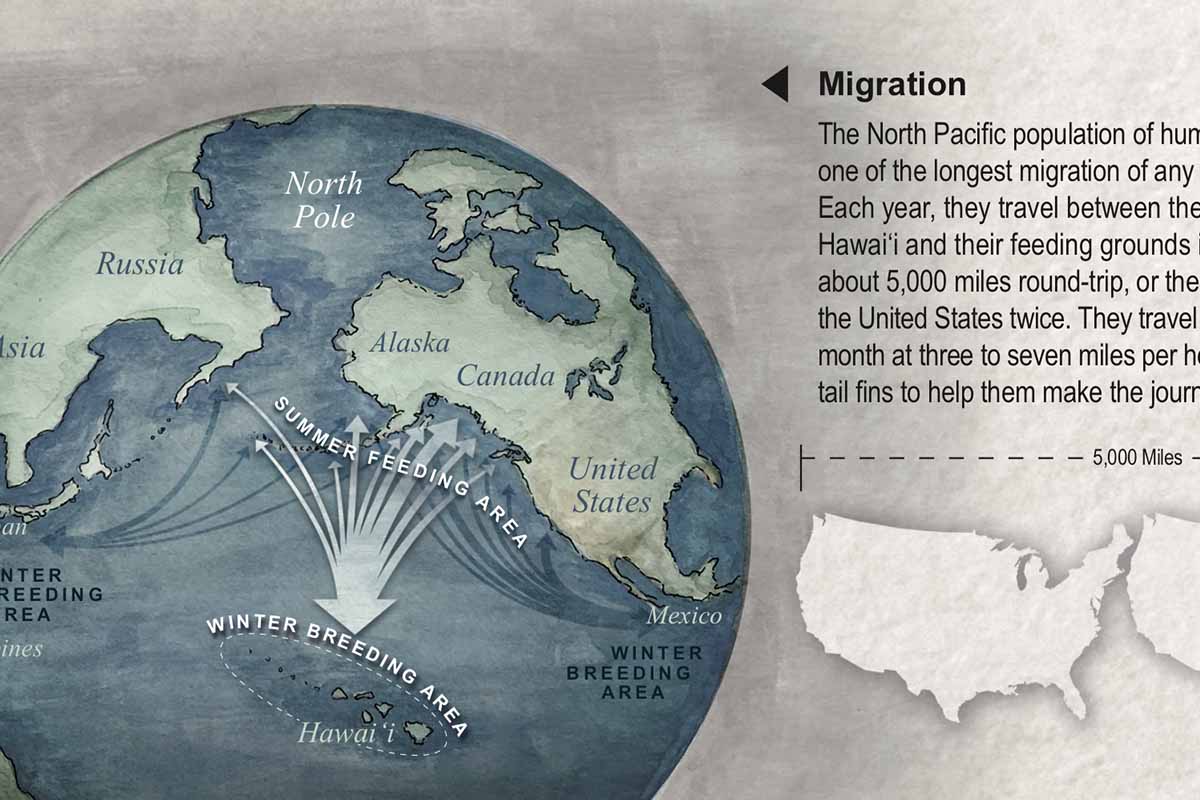
From mapping the life cycle of a whale fall on the deep seafloor, to illustrating shark diversity across sanctuary waters, to exploring the cultural and ecological connection between surfing and marine conservation, each visualization is built to inform, inspire, and educate. These works appear in NOAA’s Earth is Blue Magazine, are used widely in outreach, interpretation, and education efforts, and even featured in educational textbooks.
Explore the full visual stories here: